Using music as a way to observe how we feel
Music already understands us, but current tools don’t
People already use music to process emotion, but most tools treat it as background. This project turns music into a way of understanding yourself.
Journaling apps feel disconnected from real experiences, and music apps don’t recognize emotional context. The connection between what you feel and what you listen to gets lost.
What happens when you stop separating feeling from listening
I thought about how something as necessary as food could feel complicated. Whether it's access, awareness, time, or the quiet hesitation that comes with asking for help, I wanted to design something that makes support feel normal. Not something you have to search for or second guess.
Noticing what people already do instead of asking for more
-
Through research and empathy mapping, I found that:
People struggle to put emotions into words
Journaling can feel like effort
Music is already doing that emotional work
That shift changed the direction of the project. Instead of asking users to do more, I wanted to build on what they’re already doing.
-
Integrity, creativity, and empathy shape the way we work. These aren't just words—they’re the foundation of everything we build.
-
What began as a passion project has evolved into something more. We’re proud of where we’ve been and even more excited for what’s ahead. What sets us apart isn’t just our process—it’s the intention behind it. We take time to understand, explore, and create with purpose at every turn.
-
Item description
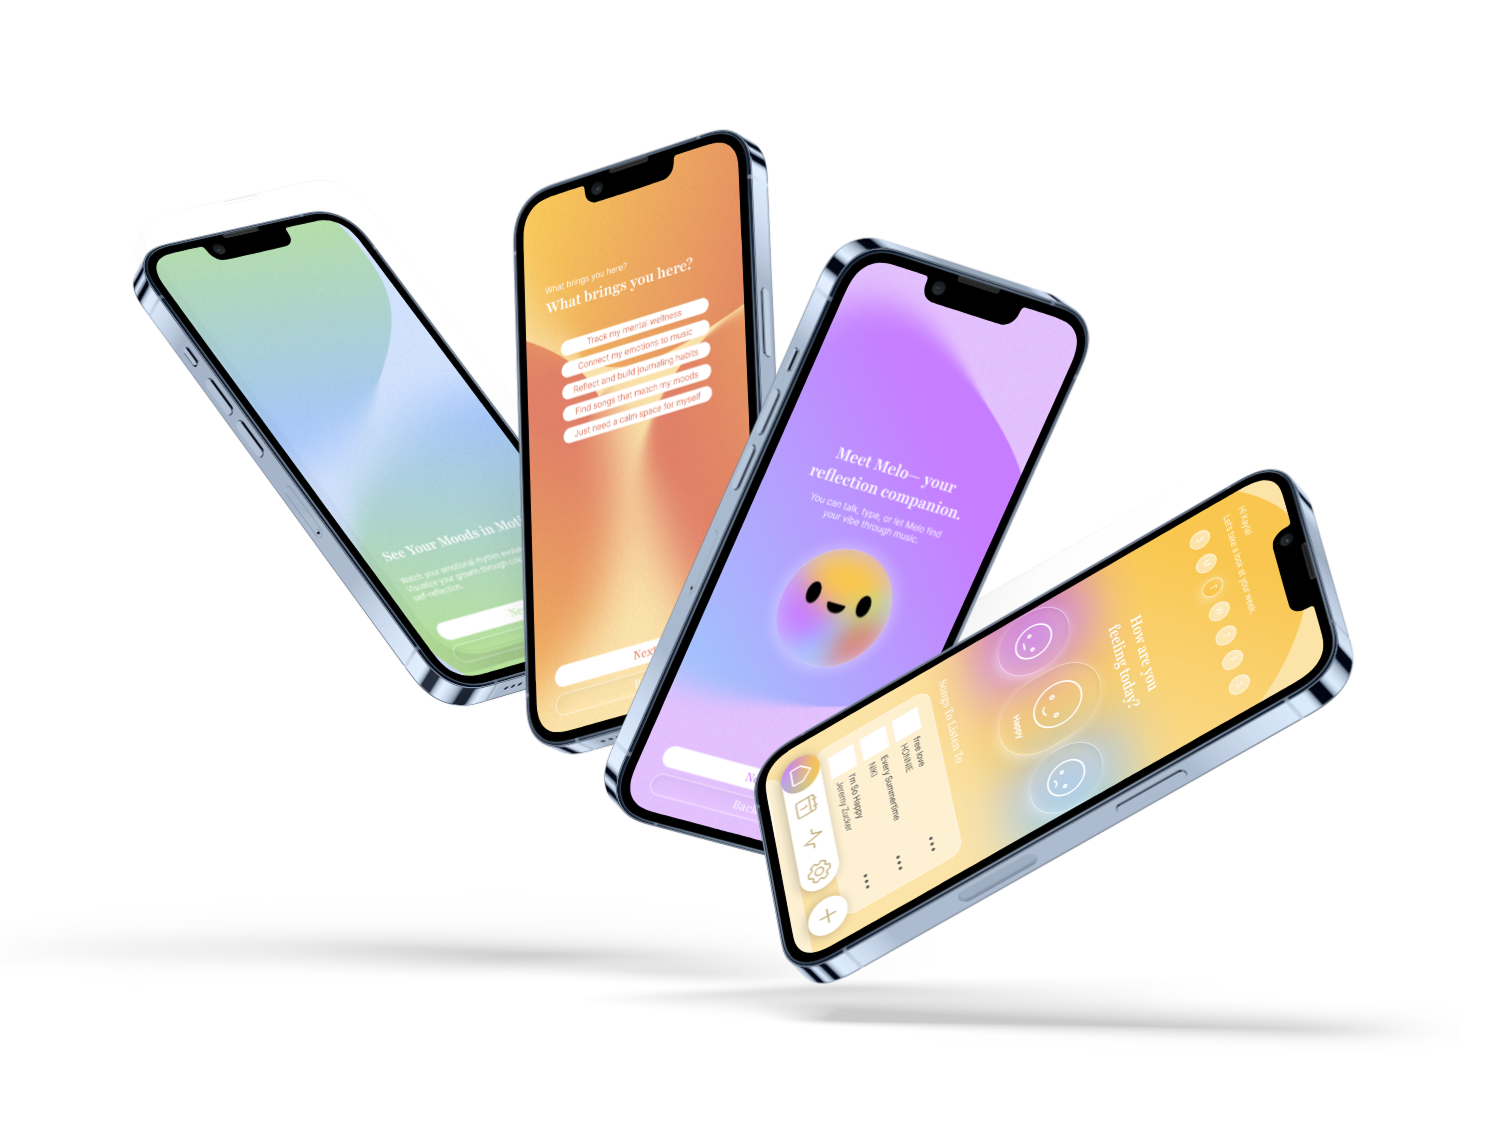
Turning music into a space for reflection
A journaling experience that feels less like writing and more like living. Music becomes the entry point, and reflection follows after.
01
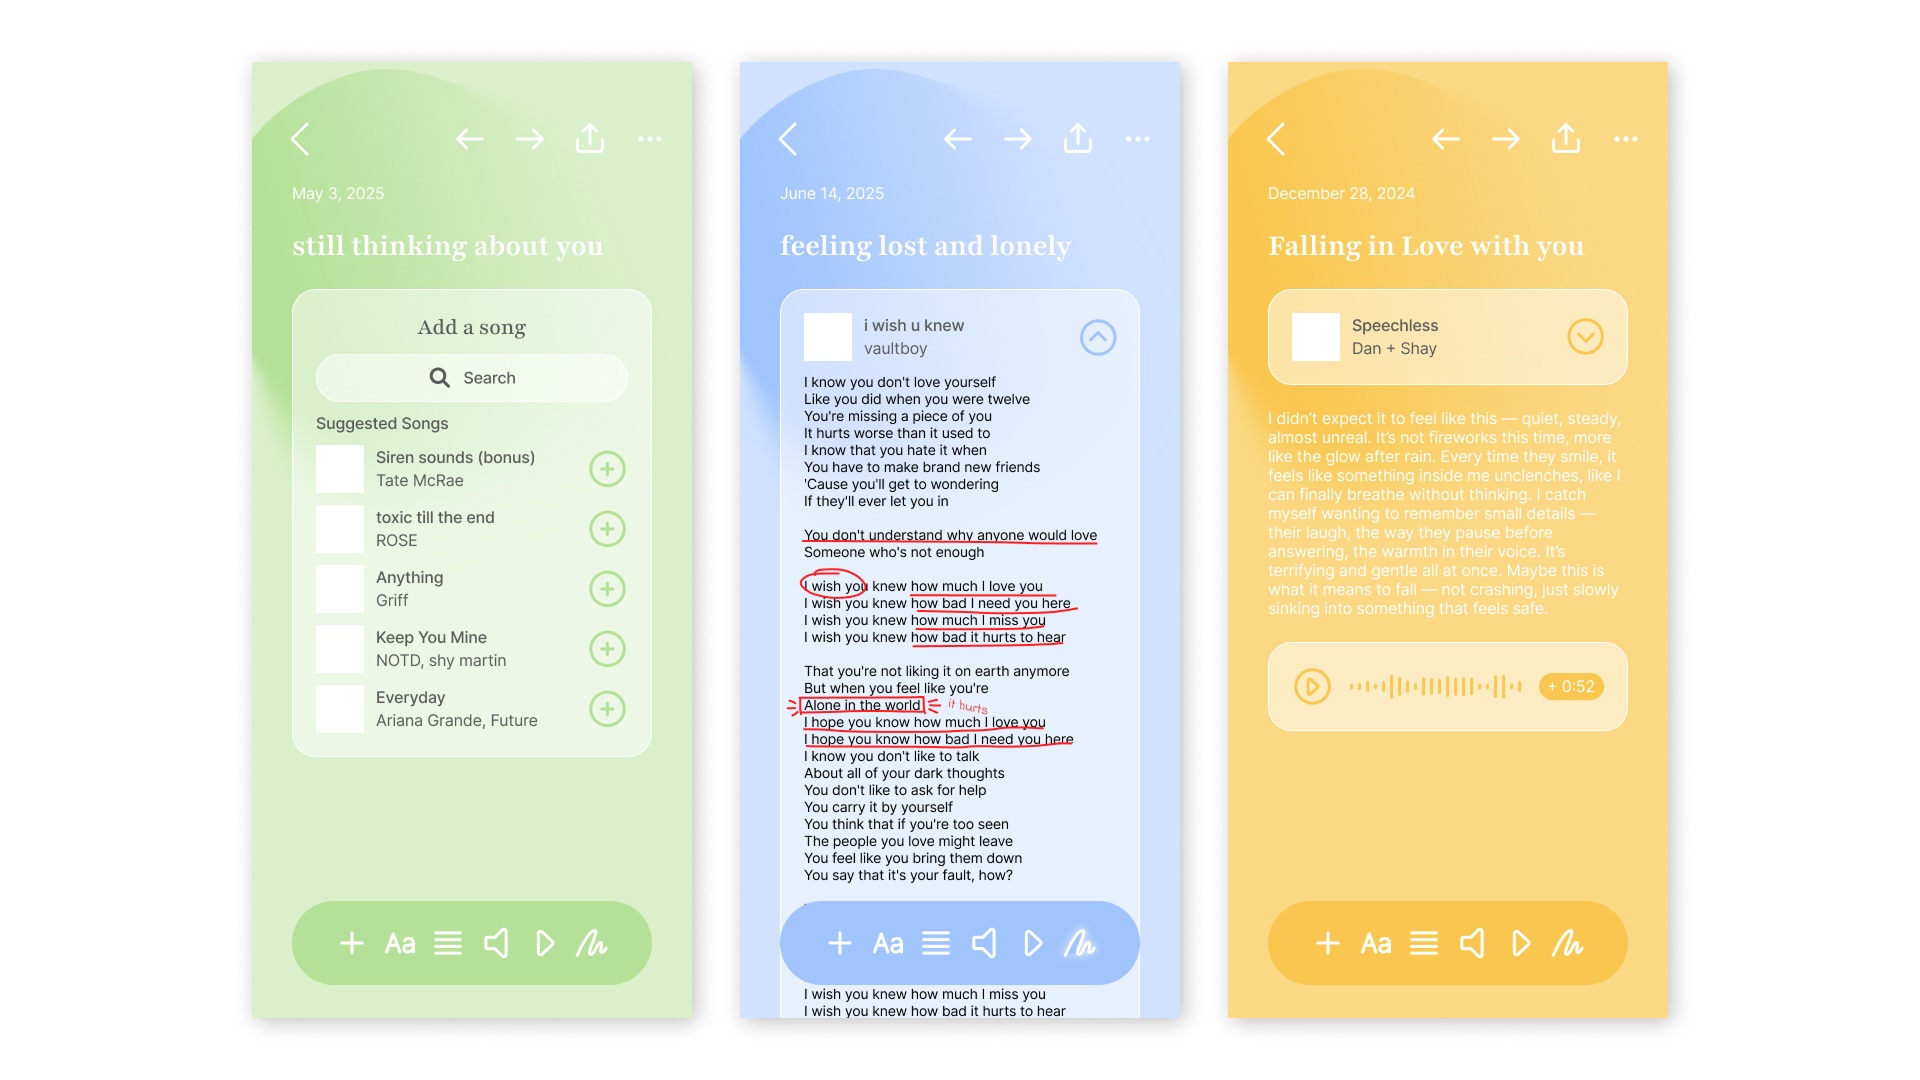
Voice and audio journaling for low-effort expression
02
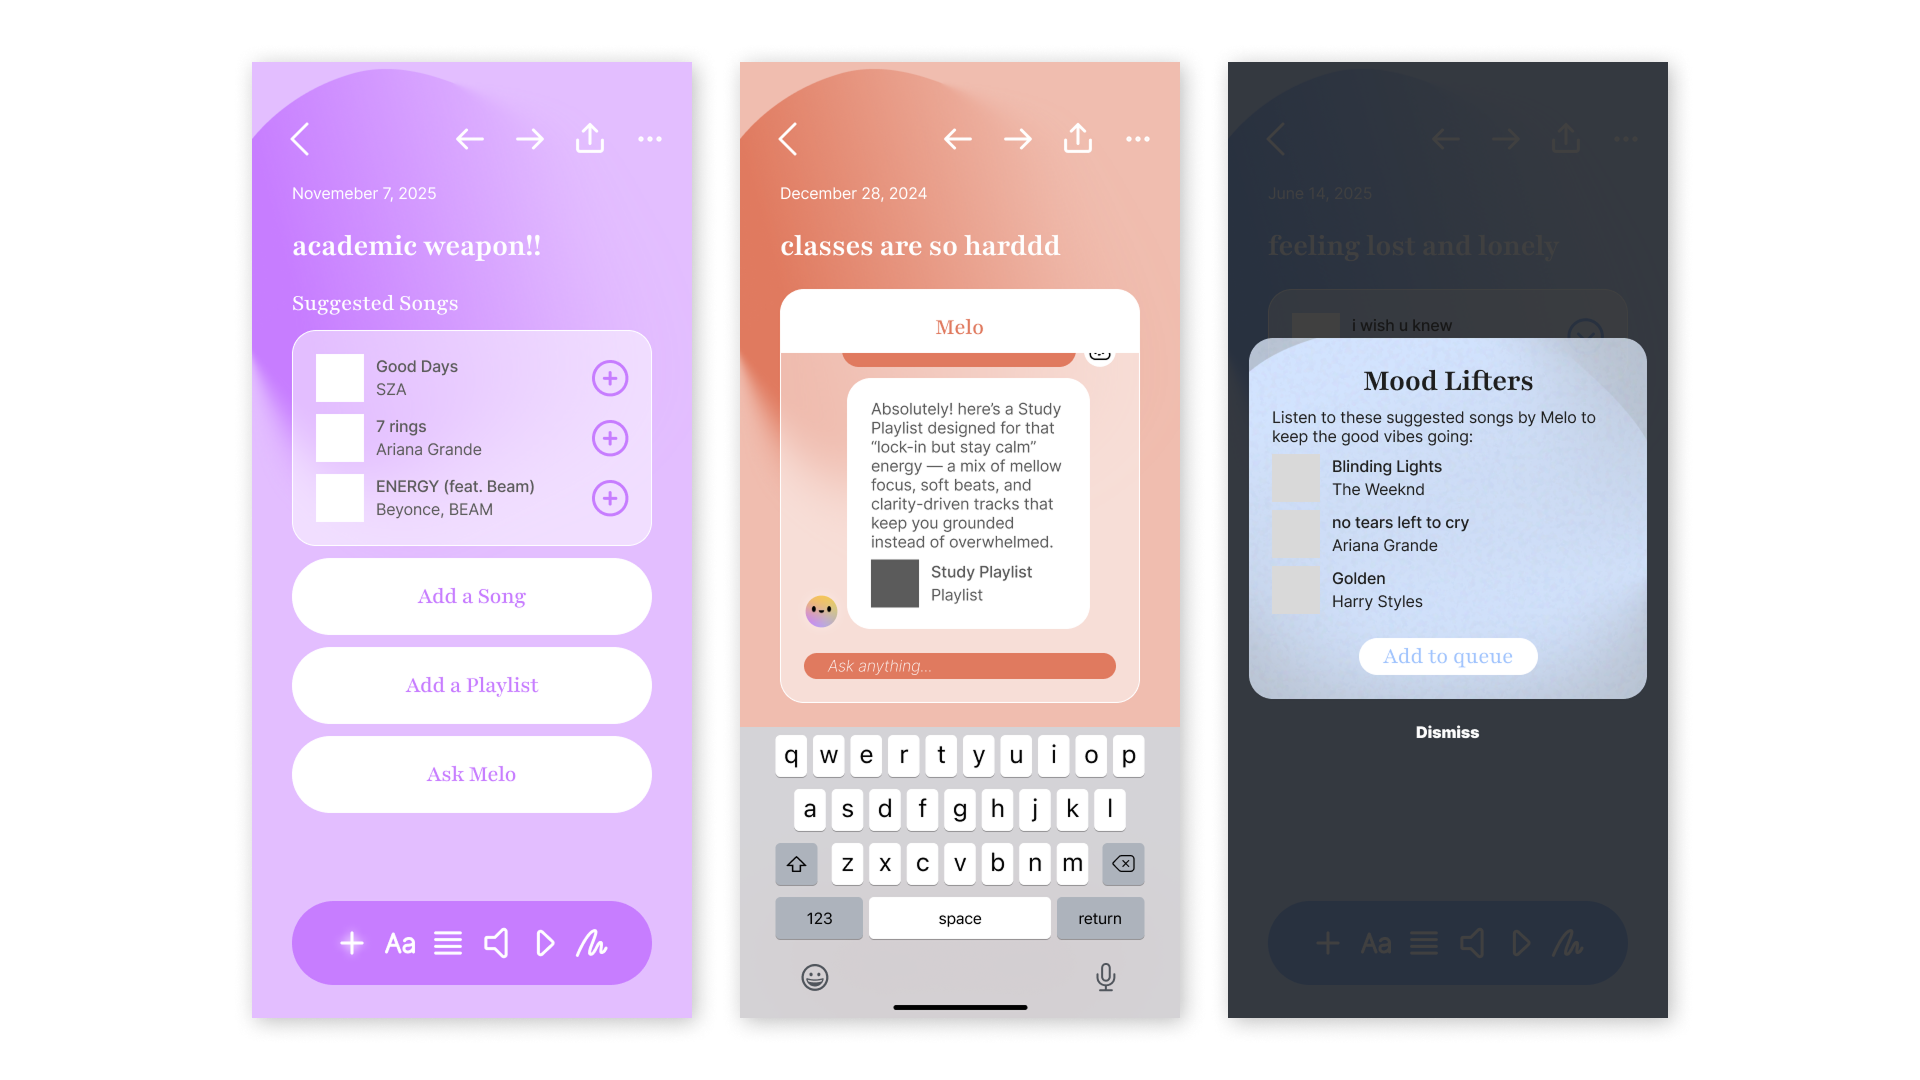
Guided prompts that connect music and mood
03
Integration with streaming platforms
04
Voice and audio journaling for low-effort expression
More than just an interaction
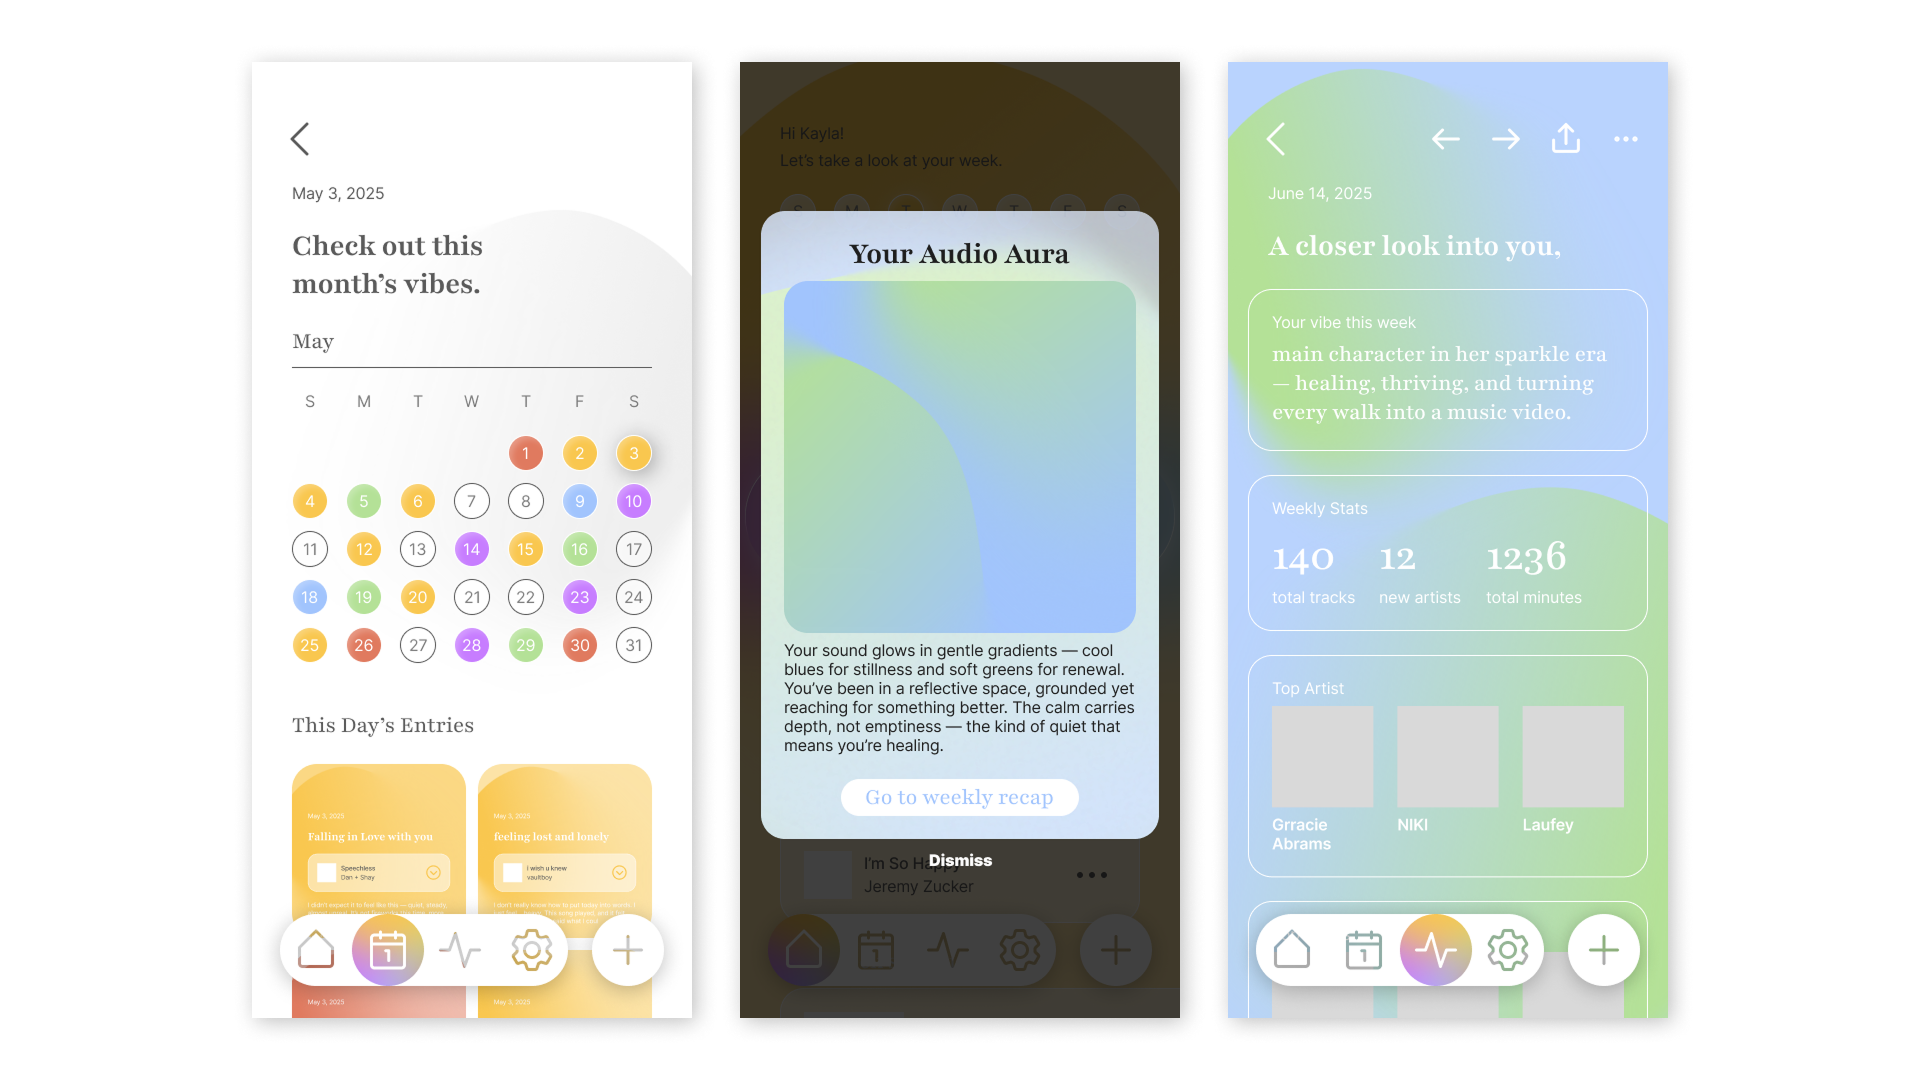
This project focuses on functionality in an emotional sense. It treats design as something that supports reflection instead of a means to organize it.
How do you measure something this personal?
If I could progress this project, I would want to explore how accurate and meaningful the insights feel over time. Reflection is personal, and the system needs to feel like it understands that.